For some time now I have been using OpenHAB at home for the central control of my house. In OpenHAB, for example, I manage shading, control some lamps, measure and visualize the energy consumption of certain consumers such as refrigerators or washing machines.
The biggest consumer in the house I have not connected yet, my heating. This is a Terra ML Complete HGL heat pump from iDM.
A little research on theire website has shown that the key figures of the machine can be read out via TCP (i. e. Ethernet) via the MODBUS protocol.
Since I didn’t find more detailed information on the internet about how to read the data, I would like to document this on this page.
Necessary tools/software
- OpenHAB 2
- node-red
- node-red module node-red-contrib-modbus
- node-red module node-red-contrib-openhab2
OpenHAB
First you have to create items in OpenHAB in which the values of the heat pump will be stored in the future:
| |
I tried to read out the machine directly via the MODBUS binding of OpenHAB, but unfortunately I failed. Therefore I use the detour via node-red.
node-red
Flow
In node-red I created the following flow:

node-red flow
Modbus Read
“Modbus Read” reads the data in hex format from the heat pump, this module is configured as follows:

read modbus register
Modbus Connect
The server (in my case “IDM Heizung”) must also be configured:

connect heatpump via modbus
Decoding Values
In the second step I pass the data to the function “decode Buffer”. This function converts the 4* 8bit hex values into a 32bit float value. The source code of the function is as follows:
| |
Payload Mapping
Via the “change” module (set msg. payload) I distribute the information to the individual OpenHAB outputs:

payload mapping in node-red
For example, such an OpenHAB Outpust is configured as follows:

OpenHAB MQTT Output
Now every 30 seconds the data of the heat pump are written to the items previously created in OpenHAB.
InfluxDB & Grafana
This data can then be persisted in an Influx database and visualized via Grafana. This tutorial shows how to do this:
https://community.openhab.org/t/influxdb-grafana-persistence-and-graphing/13761
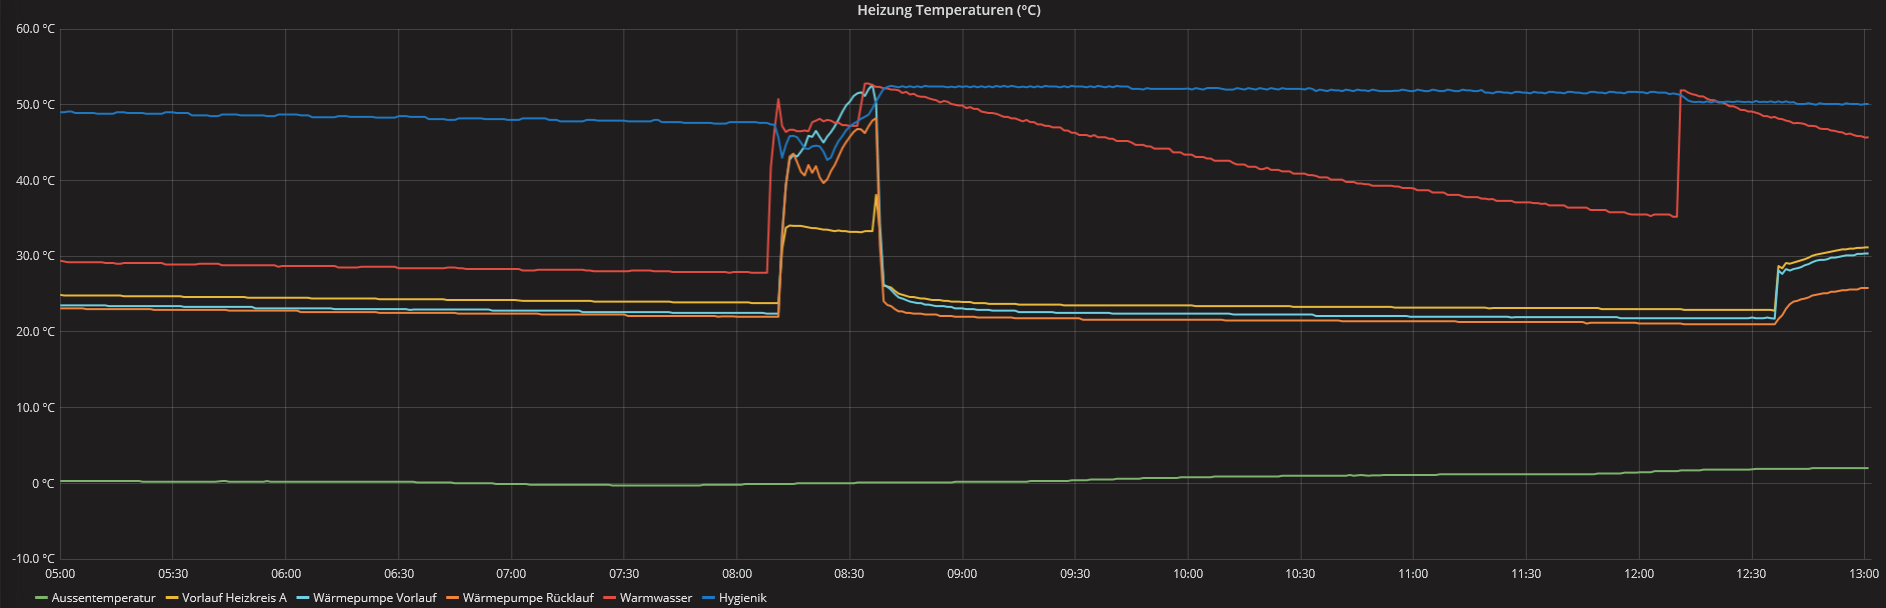
For me, for example, the result looks like this:

Visualization in Grafana
I hope you enjoyed the guide.